THE PROBLEM WITH BMI
Body Mass Index was created in the 1830s by Adolphe Quetelet, a Belgian astronomer and mathematician. Not a doctor. Not a physiologist. A mathematician looking for a quick way to describe the "average man" in population statistics. The formula — weight in kilograms divided by height in meters squared — was never designed to assess individual health.
For over a century, BMI stayed where it belonged: in actuarial tables and population surveys. Then in 1985, the NIH adopted BMI thresholds as the standard for defining overweight and obesity. In 1998, the WHO followed. Overnight, millions of people were reclassified. The formula a 19th-century astronomer invented to describe statistical averages became the global standard for individual health assessment.
It stuck — not because it was the best tool, but because it was the easiest. Two measurements: weight and height. One division. A number your doctor can write in a chart in five seconds. Convenience won.
"BMI is a 200-year-old formula invented by an astronomer who never intended it for individual health assessment. We kept using it because it was easy, not because it was right."
WHAT BMI GETS WRONG
BMI has two fundamental flaws that make it unreliable for assessing metabolic health at the individual level.
It can't tell fat from muscle
BMI divides your total weight by your height squared. It makes no distinction between fat mass and lean mass. A 6-foot (183 cm) rugby player at 220 pounds (100 kg) and a 6-foot sedentary person at 220 pounds (100 kg) get the same BMI — 29.8, classified as "overweight" — despite having completely different body compositions and health risk profiles.
This isn't a rare edge case. Anyone who carries meaningful muscle mass gets misclassified. The athlete gets flagged as overweight. The person who loses muscle with age and replaces it with fat stays in the "normal" range. BMI treats both situations identically.
It ignores where your fat lives
This is the bigger problem. Not all fat is metabolically equal. Subcutaneous fat — the kind you can pinch on your arms, thighs, and hips — is relatively benign. Visceral fat — packed inside the abdominal cavity around your liver, pancreas, and intestines — is metabolically active and dangerous. It secretes inflammatory compounds and fatty acids that directly impair insulin signaling, raise blood pressure, and worsen cholesterol profiles.
Two people with the same BMI can have completely different amounts of visceral fat. One carries weight evenly across the body. The other stores it all in the belly. BMI treats them as identical risks. They are not even close.
Researchers call this the "TOFI" problem — Thin Outside, Fat Inside. An estimated 10–20% of normal-weight adults have elevated visceral fat and metabolic dysfunction. BMI says they're fine. Their visceral fat says otherwise.
0.704 vs 0.671
WHtR AUC vs BMI AUC for predicting cardiometabolic risk
Source: Ashwell & Hsieh, Obesity Reviews, 2005 — meta-analysis of 300,000+ participants
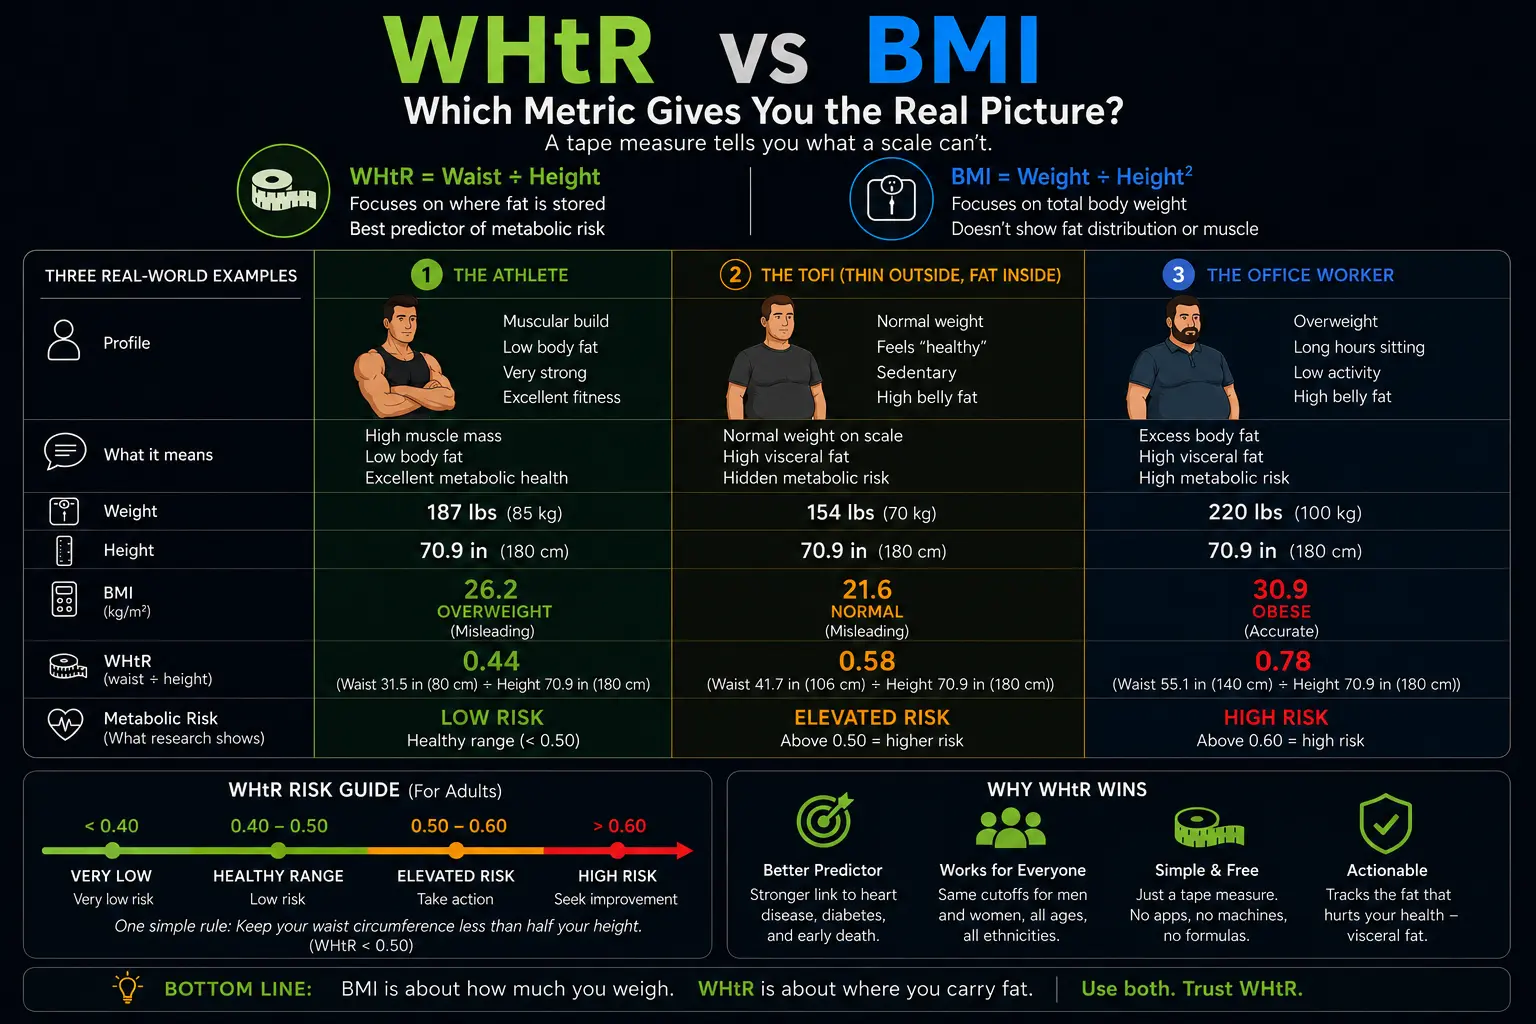
Where BMI fails — WHtR gets it right
| Person | BMI says | WHtR says | Reality |
|---|---|---|---|
| Muscular athlete 6'0" (183 cm), 220 lbs (100 kg), 33" (84 cm) waist |
29.8 Overweight |
0.45 Healthy |
Low risk |
| TOFI — "skinny fat" 5'8" (173 cm), 150 lbs (68 kg), 36" (91 cm) waist |
22.8 Normal |
0.52 Elevated |
Hidden risk |
| Average office worker 5'10" (178 cm), 195 lbs (88 kg), 38" (97 cm) waist |
28.0 Overweight |
0.54 Elevated |
Both agree |
BMI misclassifies the athlete (false alarm) and misses the TOFI individual (false safety). WHtR catches both.
Personal take
Every health app I've used shows BMI. Mine has always been a bit over the "normal" threshold, and I knew it was a rough number at best. But when I calculated my WHtR and saw it flagged elevated risk — that landed differently. BMI being high felt like a technicality. WHtR being high felt like a warning. That said, WHtR isn't perfect either. It's still a screening tool, not a diagnosis — it can't tell you whether a large waist comes from visceral fat, subcutaneous fat, or a barrel chest. What it does is tell you to pay attention. For me, the insulin resistance risk angle is what made that worth acting on.
WHAT WHTR MEASURES AND WHY IT'S BETTER
Waist-to-height ratio (WHtR) is your waist circumference divided by your height, both in the same unit. That's it.
WHtR = waist circumference ÷ height
A 5'10" person (178 cm) with a 34-inch waist (86 cm) has a WHtR of 0.48. The same person with a 38-inch waist (97 cm) has a WHtR of 0.54. The threshold is 0.5 — your waist should be less than half your height.
Why does this work better than BMI? Because WHtR directly measures central adiposity — the visceral fat that actually drives metabolic disease. It doesn't care about your muscle mass, your bone structure, or how your weight is distributed across your legs and arms. It asks one question: how much fat is packed around your midsection relative to your frame?
The 0.5 threshold is universal. It doesn't require different cut-offs for men and women (unlike waist-to-hip ratio). It doesn't need age-adjusted tables. It works across ethnicities, though some research suggests a slightly lower threshold of ~0.47 for populations of Asian descent.
WHtR vs BMI: side by side
| Feature | BMI | WHtR |
|---|---|---|
| What it measures | Total weight relative to height | Waist circumference relative to height |
| Distinguishes fat from muscle | No | Partially — ignores limb mass |
| Captures fat distribution | No | Yes — central adiposity |
| Universal threshold | Multiple categories | Single threshold: 0.5 |
| Sex-specific cut-offs needed | No, but should be | No — 0.5 works for both |
| AUC for cardiometabolic risk | 0.671 | 0.704 |
| Equipment needed | Scale + height measure | Tape measure + height measure |
Check your own ratio
Enter your height and waist measurement. Takes 30 seconds. Free, no sign-up.
Calculate my WHtR →THE RESEARCH
The case for WHtR over BMI isn't based on a single study. It's a convergence of large-scale meta-analyses spanning hundreds of thousands of participants.
Ashwell meta-analysis (2012)
Margaret Ashwell and Shiun Dong Hsieh conducted one of the most comprehensive comparisons. Across 31 studies totaling over 300,000 participants, WHtR consistently showed stronger predictive power than BMI for cardiovascular disease, type 2 diabetes, and all-cause mortality. The pooled AUC for WHtR was 0.704 compared to 0.671 for BMI — a meaningful difference at population scale that translates to real misclassification at the individual level.
Browning et al. systematic review (2010)
A systematic review by Browning, Hsieh, and Ashwell examined 78 studies and found that WHtR was a significantly better discriminator than BMI for diabetes, dyslipidemia, hypertension, and cardiovascular disease in both sexes. The review concluded that WHtR should replace BMI as the primary screening metric.
The 0.5 threshold validation
The "keep your waist to less than half your height" message has been validated across diverse populations — European, Asian, African, and Latin American cohorts. Its simplicity is a feature: a healthy waist-to-height ratio is one number anyone can remember and check at home.
WHtR risk categories
| WHtR | Category | Metabolic risk |
|---|---|---|
| Below 0.40 | Very lean | Lowest risk |
| 0.40 – 0.49 | Healthy range | Low risk |
| 0.50 – 0.59 | Elevated | Moderate risk |
| 0.60 or above | High | High risk |
HOW TO CHECK YOUR WHTR
You need a flexible tape measure and your height. That's it.
How to measure your waist correctly
- Find your lowest rib. Run your fingers down the side of your torso until you feel the bottom edge.
- Find the top of your hip bone (iliac crest). Run your fingers along the side of your hip to the top.
- Measure at the midpoint between these two landmarks — typically 2–4 cm above the navel.
- Exhale normally. Do not suck in. Measure at the end of a relaxed exhale.
- The tape should be snug but not compressing the skin. Measure twice and average.
Personal take
After I learned about WHtR I started measuring weekly. I have a smart scale that tracks weight day by day, but the tape measure tells me something the scale can't. My BMI has barely moved, but my body composition is shifting — more muscle, less central fat. WHtR picks that up. BMI doesn't.
Then divide your waist measurement by your height, both in the same unit. Or use the waist-to-height ratio calculator to do it instantly.
If the result is below 0.5, you're in the healthy range for central adiposity. If it's above, your visceral fat is likely elevated — and it's worth paying attention to. You can see exactly where you fall on the waist-to-height ratio chart.
CHECK YOUR WHTR
Two measurements. One ratio. A better answer than BMI has ever given you.
CALCULATE NOW →WHEN BMI STILL HAS A ROLE
This isn't a call to burn BMI at the stake. It still has legitimate uses — just not the one your doctor probably uses it for.
- Population epidemiology. When you're studying health trends across millions of people, BMI's simplicity is an advantage. It's cheap, fast, and consistent enough for statistical patterns to emerge. At the population level, BMI correlates with health outcomes reasonably well — it's at the individual level that it falls apart.
- Tracking trends over time. If your own BMI has climbed steadily from 24 to 30 over ten years and you haven't been bodybuilding, that's a meaningful signal regardless of BMI's flaws.
- Extreme values. A BMI of 40 means something. At the far ends of the spectrum, BMI's inability to distinguish fat from muscle matters less — very few people reach a BMI of 40 through muscle alone.
- Insurance and clinical thresholds. For better or worse, BMI thresholds trigger clinical interventions, insurance categories, and surgical eligibility. Until institutional guidelines catch up, BMI remains the gatekeeping metric.
Where BMI fails — and where WHtR should replace it — is in answering the question most people actually care about: "Am I at risk?" For that, central adiposity matters more than total weight, and WHtR measures it directly.
FREQUENTLY ASKED QUESTIONS
Is waist-to-height ratio really better than BMI?
Most large meta-analyses have found WHtR outperforms BMI for predicting cardiovascular disease, type 2 diabetes, and metabolic syndrome — and the margin isn't trivial. The key advantage is that WHtR measures where fat accumulates, not just how much you weigh. Central adiposity — fat around the organs — is the primary metabolic risk driver, and BMI is blind to it.
What is a healthy waist-to-height ratio?
Below 0.5 — your waist should be less than half your height. Below 0.4 is very lean. Between 0.5 and 0.6 is elevated risk. Above 0.6 is high risk. The threshold holds across men and women without needing different reference ranges, which makes it simpler and more universal than most other body metrics. See the full breakdown on the healthy waist-to-height ratio page.
Does WHtR work for athletes and muscular people?
Better than BMI does. BMI penalizes anyone with significant muscle mass — a lean 200-pound (91 kg) athlete gets labeled "overweight" alongside a sedentary 200-pound (91 kg) person of the same height. WHtR focuses on the waist, so large legs, shoulders, and arms don't inflate the score. The only edge case is people with heavily developed obliques and core muscles, where a larger waist circumference comes from muscle rather than fat. In practice, this is rare enough that WHtR remains far more accurate than BMI for athletic populations.
Should I stop tracking BMI entirely?
No need to stop — just stop treating it as the primary indicator. BMI is useful for tracking general weight trends over time and has value in population statistics. But if you want to know your metabolic risk, WHtR gives you a more accurate answer. Track both, but act on WHtR.
Personal take
I still glance at my BMI on the smart scale, but it's background noise now. What I actually track is waist circumference — weekly, same day, same time. When you're changing your body composition rather than just losing weight, BMI flatlines while WHtR moves. That's the metric I trust with real decisions.
What if my BMI is normal but my WHtR is high?
This is the TOFI pattern — Thin Outside, Fat Inside. It means you carry disproportionate visceral fat despite having a normal overall weight. Researchers estimate 10–20% of normal-weight adults are metabolically unhealthy, and WHtR is one of the best ways to identify them. If your WHtR is above 0.5 with a BMI in the "normal" range, it's worth discussing with your doctor — particularly requesting a fasting insulin test and a lipid panel to check for early metabolic dysfunction.
How do I lower my waist-to-height ratio?
Visceral fat is actually more responsive to intervention than the subcutaneous fat you can pinch. A moderate caloric deficit (500–750 kcal/day), resistance training to build insulin-sensitive muscle, and reducing ultra-processed food intake have the largest effects. Studies consistently show that even a 5–7% reduction in body weight reduces visceral fat by 10–20% — because visceral fat is metabolized first. The change in waist circumference often appears before the scale moves significantly.
REFERENCES
- Ashwell, M., Gunn, P., & Gibson, S. (2012). Waist-to-height ratio is a better screening tool than waist circumference and BMI for adult cardiometabolic risk factors: systematic review and meta-analysis. Obesity Reviews, 13(3), 275–286.
- Browning, L. M., Hsieh, S. D., & Ashwell, M. (2010). A systematic review of waist-to-height ratio as a screening tool for the prediction of cardiovascular disease and diabetes. Nutrition Research Reviews, 23(2), 247–269.
- Ashwell, M., & Hsieh, S. D. (2005). Six reasons why the waist-to-height ratio is a rapid and effective global indicator for health risks of obesity and how its use could simplify the international public health message on obesity. International Journal of Food Sciences and Nutrition, 56(5), 303–307.
- Quetelet, A. (1835). Sur l'homme et le développement de ses facultés, ou Essai de physique sociale. Paris: Bachelier.
- Araújo, J., Cai, J., & Stevens, J. (2019). Prevalence of optimal metabolic health in American adults: National Health and Nutrition Examination Survey 2009–2016. Metabolic Syndrome and Related Disorders, 17(1), 46–52.
BluntCalc
Independent health calculator project. Evidence-based tools, no BS. Every claim in this article is sourced from peer-reviewed research cited above. We are not doctors — we build calculators that make real research accessible. Always consult a healthcare professional for medical decisions.